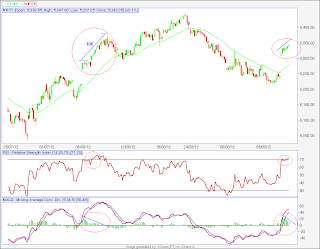
It seems the one news from ECB has given the markets that Xcuse which it was searching for.
While on the forefront, fogginess and uncertainty was apparent--certain clues were being given and should have been latched on to.
The foremost was this trendline test:

1.Positive Divergence;
2.Bullish cross-over on MACD(5.34)
3.5EMA/10EMA were on the verge of bullish cross-over.
But I thought at least one dip below the current low would be made and therefore kept holding on to my 5400pe.

And as often happens near the base or top---either they are prolonged to tire out or cut short to catch on the wrong foot---it seems the ECB news has given that fillip which would lead to bounce up from the TL to the upper red channel.
And then how do we label this ABC from 5448 to 5217??
Although now it is of academic interest only but labels have to be seen in proper perspective---
.png)
Thus , though I was very close to picking the bottom---expected it to be below 5200.
Showing that I am not yet good enough.
But the attempt to become good enough continues-------
And to put the larger picture into perspective:

.png) EOD
EOD
R1 was tested and conquered today:
 Destination remains R3.
Hour charts have gone into overbought zone. Dips should be used for going long and whether dips should be traded--that would be on an individual's risk appetite. MACD histogram is already showing a negative divergence but one should not be in a hurry to play for retracement--Chart below also exemplifies how negative divergence on Hourly MACD histogram continues while price went up by 100 points. Wait for bearish cross-over before shorting.
.png)
EW wise--on higher degree-- too I would recall my labels:
.png)
While on the forefront, fogginess and uncertainty was apparent--certain clues were being given and should have been latched on to.
The foremost was this trendline test:

I was posting this particular trendline but thinking that "that panic which occurs near the bottom" has yet to occur and so feeling in the heart of my heart that reversal would begin from the red channel near 100 DMA.
And the other clues on Hour charts were:1.Positive Divergence;
2.Bullish cross-over on MACD(5.34)
3.5EMA/10EMA were on the verge of bullish cross-over.
But I thought at least one dip below the current low would be made and therefore kept holding on to my 5400pe.

And as often happens near the base or top---either they are prolonged to tire out or cut short to catch on the wrong foot---it seems the ECB news has given that fillip which would lead to bounce up from the TL to the upper red channel.
And then how do we label this ABC from 5448 to 5217??
Although now it is of academic interest only but labels have to be seen in proper perspective---
.png)
Thus , though I was very close to picking the bottom---expected it to be below 5200.
Showing that I am not yet good enough.
But the attempt to become good enough continues-------
And to put the larger picture into perspective:

.png)
R1 was tested and conquered today:

Hour charts have gone into overbought zone. Dips should be used for going long and whether dips should be traded--that would be on an individual's risk appetite. MACD histogram is already showing a negative divergence but one should not be in a hurry to play for retracement--Chart below also exemplifies how negative divergence on Hourly MACD histogram continues while price went up by 100 points. Wait for bearish cross-over before shorting.
.png)
EW wise--on higher degree-- too I would recall my labels:
.png)
No comments:
Post a Comment