Continuing from yesterday's post:
Q
A=6042-5964=78
B=5964-6005* 61.8% retracement means 6012
C to follow.
Ideally C=A.
UnQ
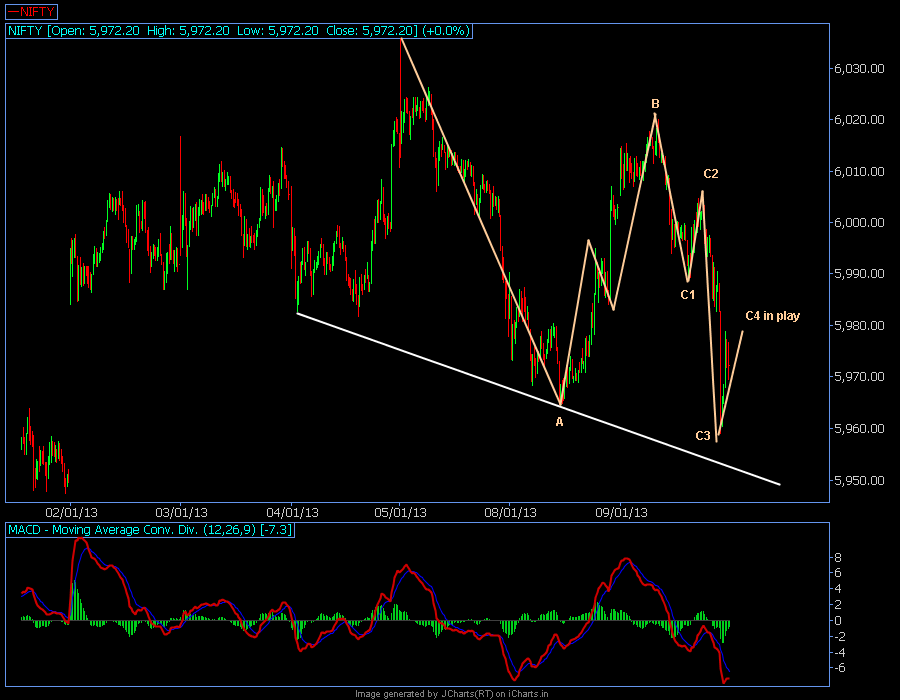
B continued to do 6020 and then C downward started.
Ideally C=A gives us a target of (6020-78)=5942
 C can be either a 5w Impulse or an Ending Diagonal and as it stands now,both possibilites are open.
If the C4 continues upwards and enters C1 territory i.e above 5989.25 then ED probability would become confirmed and we would have a C wave fanning out as
C1=6020-5989.25=30.75
C2=5989.25-6004.65=15.4
C3=6004.65-5959=45.65
C4=5959- into C1 territory
C5 would do more than C3
If however C4 doesnot enter C1 territory then either C5 would be only (upto)28.25 so that C3 becomes extended vis-a vis C5 or C5 itself would get extended by doing minimum 50 points
.png) Hour Chart:
Hour Chart:
.png)
Tail in the last hour candle and positive divergence tells me that a strong opening would be there and if it goes above 5989.25, easiest trade would be SHORT with a Stop-loss at 6005 and target minimum 47 points down.
And the Daily Chart reminds me that we are pretty close to a channel top and negative divergence is also quite conspicuous.
.png)
Q
A=6042-5964=78
B=5964-6005* 61.8% retracement means 6012
C to follow.
Ideally C=A.
UnQ
B continued to do 6020 and then C downward started.
Ideally C=A gives us a target of (6020-78)=5942
If the C4 continues upwards and enters C1 territory i.e above 5989.25 then ED probability would become confirmed and we would have a C wave fanning out as
C1=6020-5989.25=30.75
C2=5989.25-6004.65=15.4
C3=6004.65-5959=45.65
C4=5959- into C1 territory
C5 would do more than C3
If however C4 doesnot enter C1 territory then either C5 would be only (upto)28.25 so that C3 becomes extended vis-a vis C5 or C5 itself would get extended by doing minimum 50 points
.png)
.png)
Tail in the last hour candle and positive divergence tells me that a strong opening would be there and if it goes above 5989.25, easiest trade would be SHORT with a Stop-loss at 6005 and target minimum 47 points down.
And the Daily Chart reminds me that we are pretty close to a channel top and negative divergence is also quite conspicuous.
.png)
No comments:
Post a Comment